Online appendix for the paper
entitled: "Recommending API Function Calls and Code Snippets to Support
Software Development" submitted to the IEEE Transactions on Software
Engineering
As a reference, we count and depict in Figure 1 the top 20 popular invocations in the dataset. We see that the most
popular API in the dataset is java/lang/StringBuilder/append(java.lang.String) and it
appears in 2,512 projects (apps) and 54,828 declarations. This corresponds to
96.61% of the total number of projects having this API in their source code.
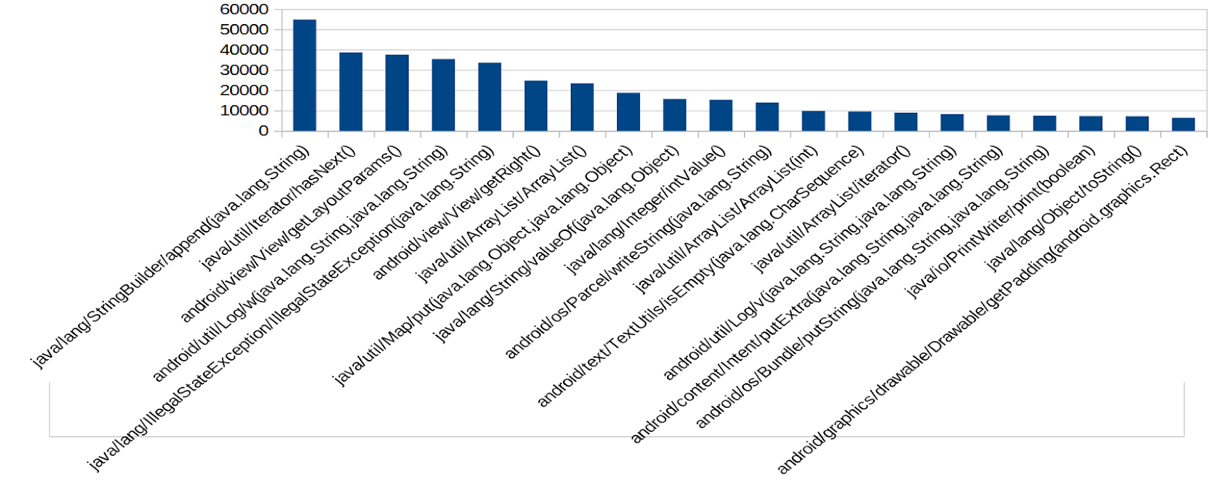
Figure 1 The Top 20 popular invocations
In this respect,
we anticipate that a recommendation engine may succeed, even without any great
effort, if it tries to suggest the most popular APIs. Thus, we performed an
additional experiment to see if FOCUS behaves in that way. In particular, by
setting the cut-off value N=10, we collected the list of APIs that have been
recommended for all the 2,600 apps in the dataset and ranked them in descending
order. The most 20 recommended APIs are displayed in the Figure 2.
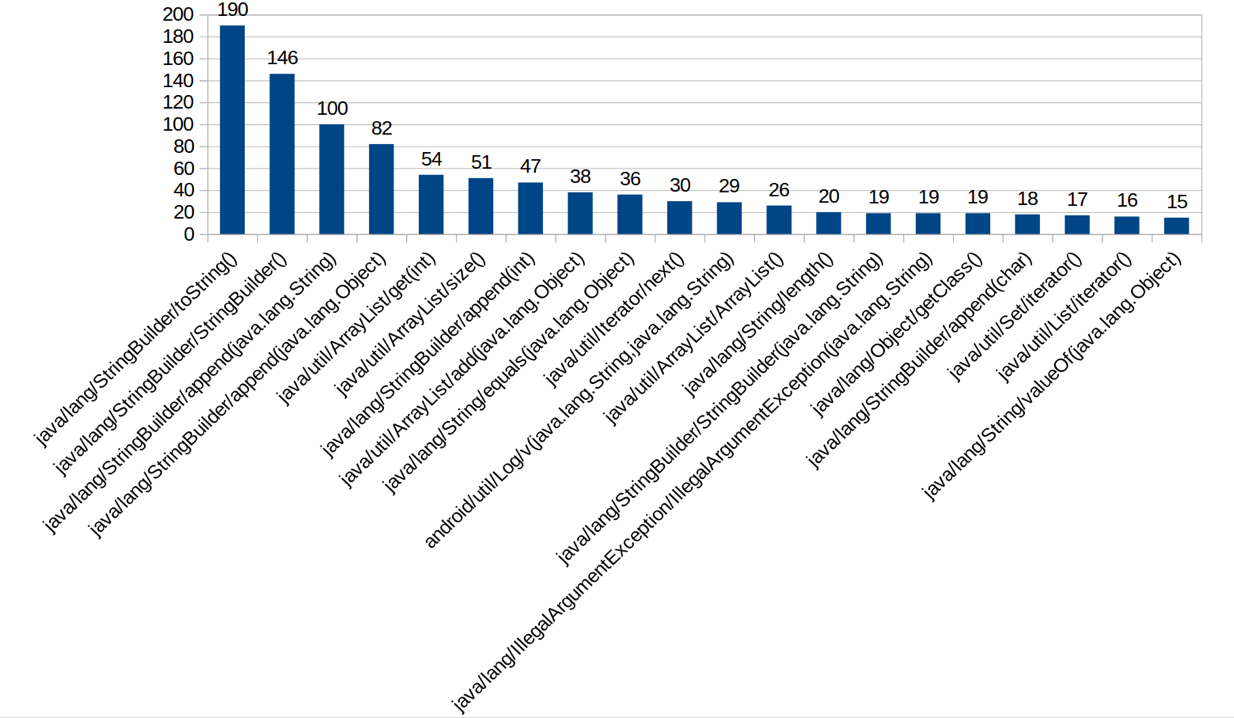
Figure 2 The most 20 recommended APIs
In the ICSE paper, to compare FOCUS
with PAM, we could use only 200 projects of small size and the performance of
our approach was quite low. In the extended paper, we considered 500 apps in
the evaluation against PAM and the accuracy was substantially improved. We
attributed the improvement to the background data. However, as said by the
reviewer, this can also be due to the fact that Android apps are highly
dependent on third-party libraries.
To validate this hypothesis, we count
the number of unique APIs in each app/project for both the Android dataset and
the GitHub dataset used in our ICSE paper. The final results are shown in the
violin boxplots below. From the Figure 3,
it is evident that the apps in the Android dataset contain more APIs compared
to the GitHub projects. Many apps have more than 500 unique APIs. Meanwhile,
most of the GitHub projects have less than 200 unique APIs.
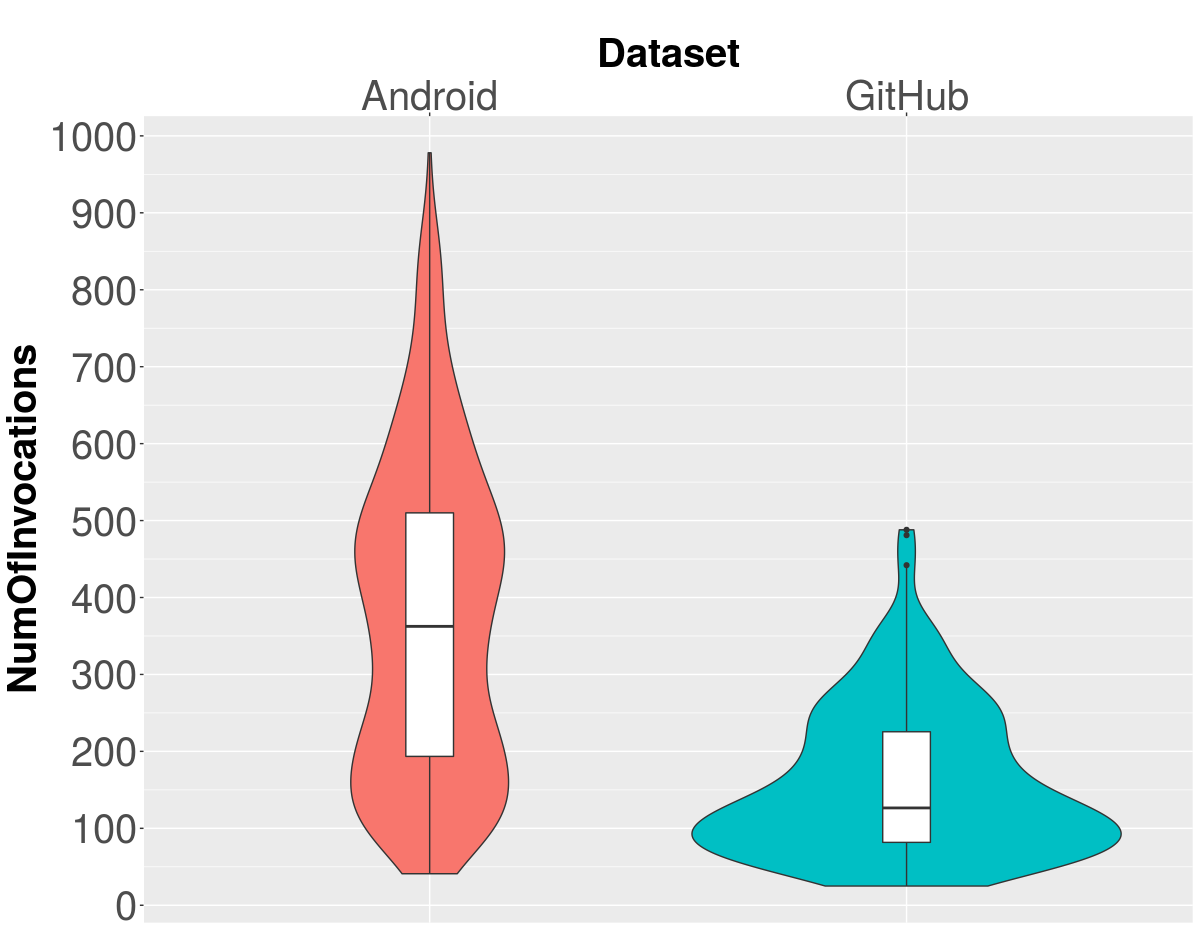
Figure 3 The datasets distribution
A summary of the categories and their corresponding number of items is
provided in Figure 4.
The apps span a wide range of categories, e.g. Education,
News & Magazines, Comics. Most of them contain a small number
of apps, i.e., ranging from 1 to 20 items for each category. The category
containing the largest number of apps is Tools with 659 apps, while
there are three categories with only two apps, i.e., Trivia, Music,
and Parenting.
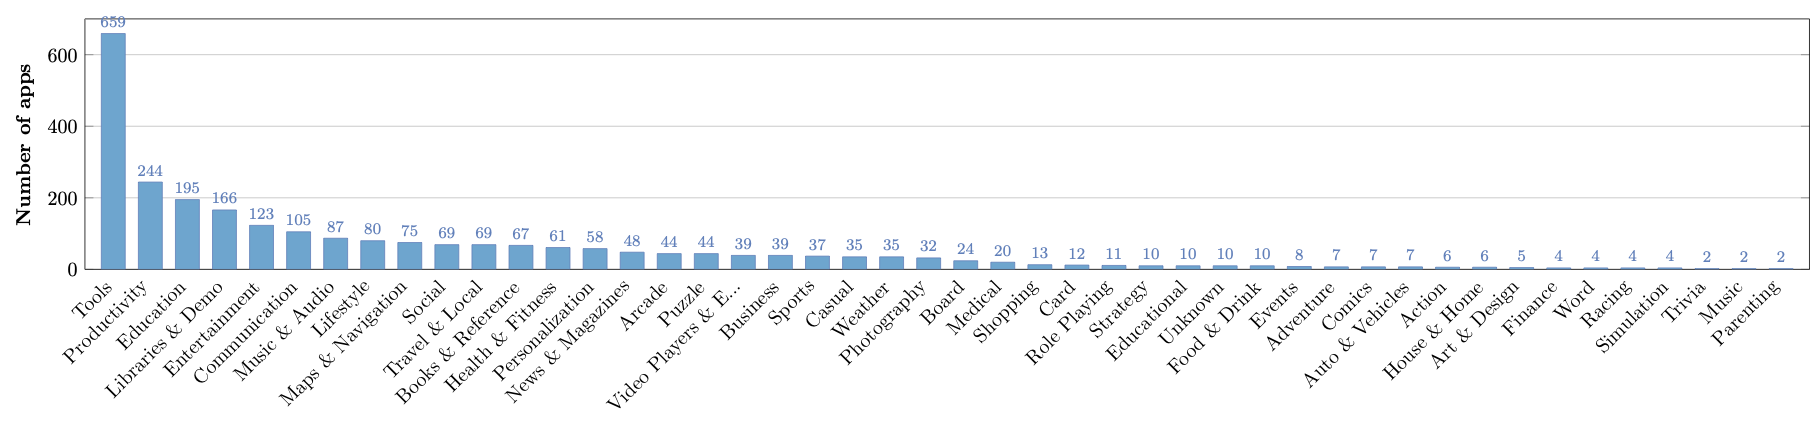
Figure 4 The categories and their
cardinality
The APK
dataset consists of 2,600 APK binary files (mined from Apkpure)
together with additional metadata (mined from Google Play), including authors,
categories, star rating, price, and the number of downloads. Figure 5 depicts a map of the apps with
respect to the number of stars and downloads. As can be seen, the apps are
scattered across the map: there are apps that locate on the lower part of the
figure, indicating a low rating as well as a low number of downloads.
Meanwhile, most of them are highly rated and they have a high number of
downloads.
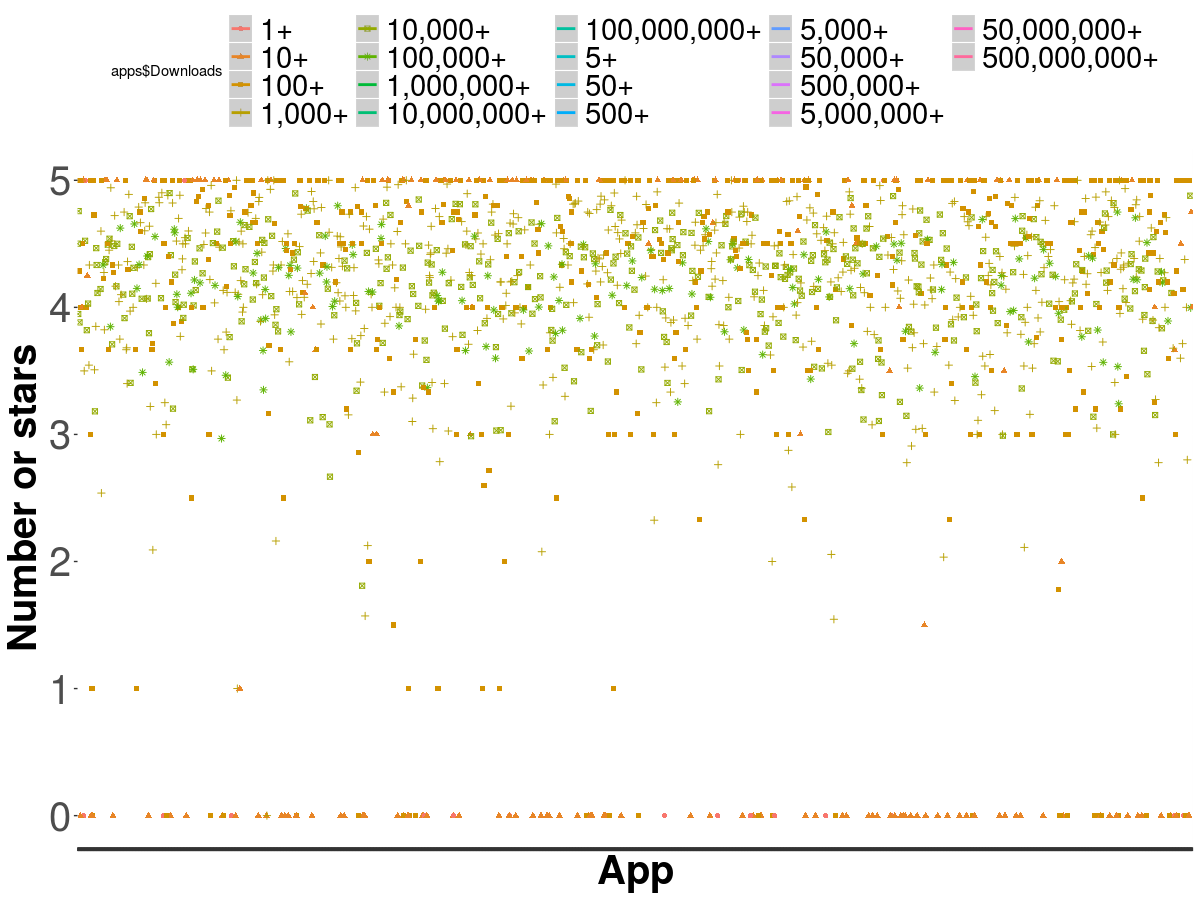
Figure 5 Summary of the dataset - Number of stars and downloads
In Figure 6, we display statistics about the
apps, \ie to their number of
invocations and declarations, after they have been parsed using Rascal. The
figure shows that the apps contain a wide range of number of API calls and
declarations.
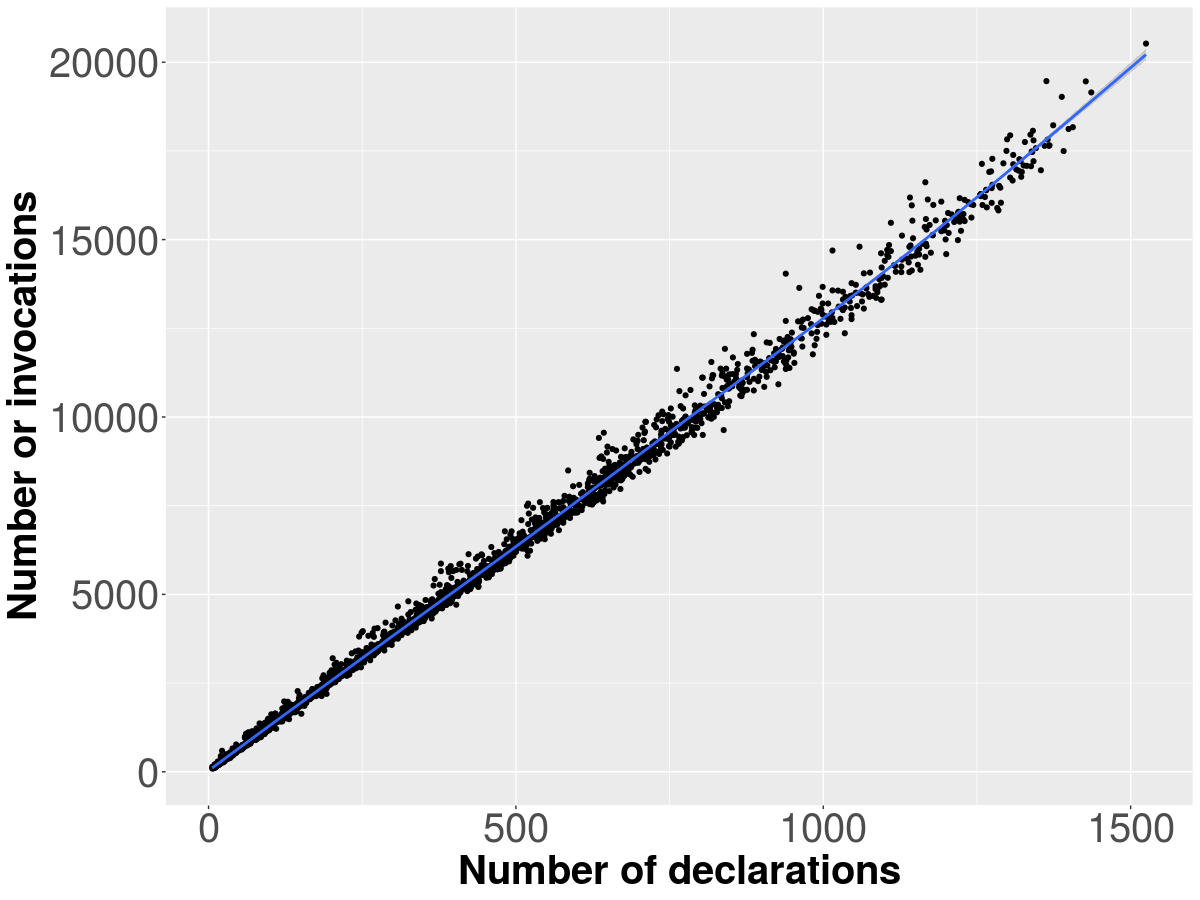
Figure 6 Summary of the dataset - Number of declarations and
invocations
Figure 7 reports the distribution of all the
invocations in the dataset: we count the frequency of occurrence for all
invocations in the projects and declarations.
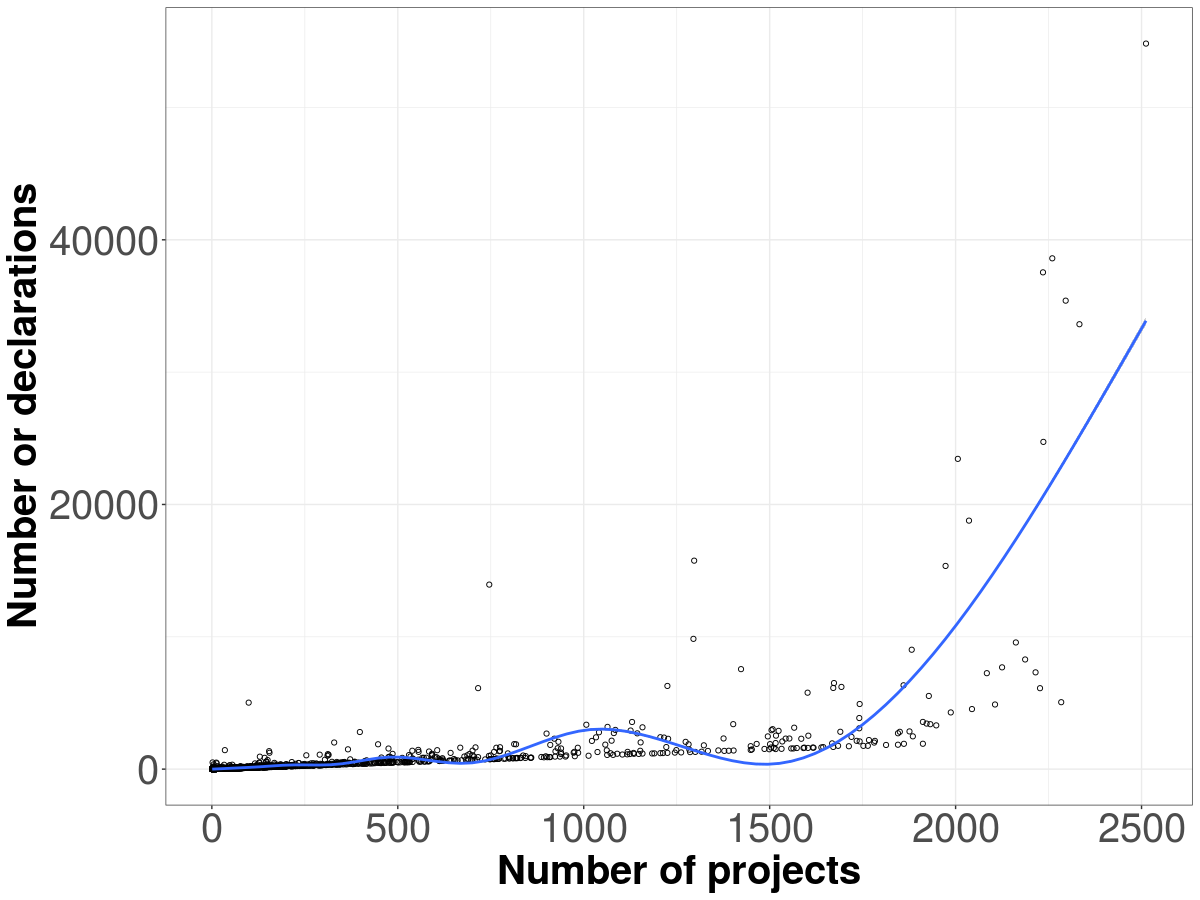
Figure 7 Summary of the dataset - Distribution of invocation